I was helping the new guy on our team look at something, and I think I almost gave him a heart attack.
It takes FOREVER to launch the app when you click that green bug. I hate that green bug. Save yourself some heartache:Scared new guy when I yelled "NOOO!" as he was about to click green bug. Run then attach when debugging. #AndroidDev pic.twitter.com/cFUNKDu0f1— Zarah Dominguez (@zarahjutz) February 5, 2016
- Put in your breakpoints
- Launch the app as you normally would
- Navigate to the offending activity
- Attach Debugger to Android Process
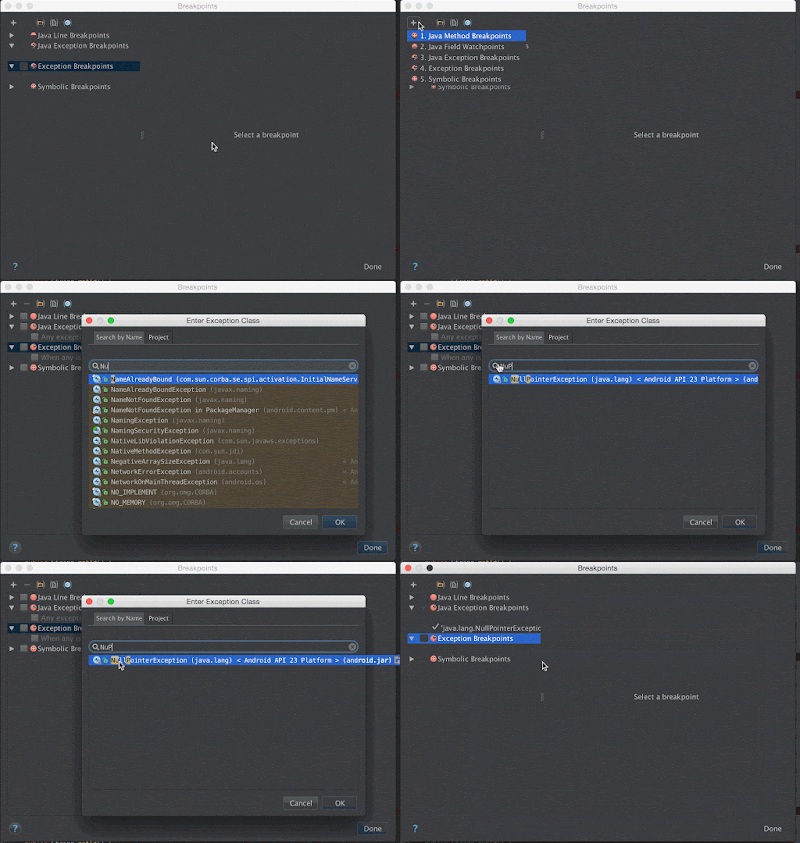
App encountering what looks like random crashing? Put in some exceptionally useful Exception Breakpoints! In the Breakpoints dialog (⌘+⇧+F8 / CMD+SHIFT+F8), click on the +, choose Java Exception Breakpoints and add the exception you are interested in.
This means that even without actual breakpoints -- as long as the debugger is attached to the process -- Android Studio will suspend the process on the exact line that will throw the exception. Very easy way of narrowing down on the root cause!
But what if (God forbid!) you uncover another issue while debugging? Now you have a ton of breakpoints but you don't want to remove them because what if you still haven't fixed that other thing and this line is really important but you don't want to stop all the time. Ugh. It's a mess!
Make some semblance of order out of the chaos. Group your breakpoints. A breakpoint group can contain any number of any kind of breakpoint that Android Studio supports. This allows you to mute/unmute a set of breakpoints without having to hunt them down one by one.
Just choose the interesting breakpoints, right click, then choose Move to group. From here you can either create a new group or add them to an existing group. You can configure each breakpoint to behave how you want them to: suspend the thread, log a message, hit and forget, etc.
Here's the whole thing, in one magnificent gif.
Again, apologies to +Nick Butcher. I owe you a beer next time you're in Sydney, Nick.

