Showing posts with label debugging. Show all posts

11 June 2016

More Watches Love and a note on Context

I have previously written about debugging and how Watches can help make inspecting things in your code easier. Today, I would like to reiterate how powerful Watches can be.

When something fails in my code and I'm lucky, I would have a vague idea of what may be causing it. So I launch my app then attach the debugger (NO! to the green bug!); I am stopped at a breakpoint and while staring at the offending line, a "Wait, what if it's this other thing that's causing it?" pops into my head.

If you are used to debugging by peppering your code with Logs or Timbers or Toasts (and there's nothing wrong with that!!), you would have to stop debugging, add the logs, and re-launch your app (thank God for Instant Run!).

However, we can leverage Watches to make this process a whole lot easier. While stopped at a breakpoint, just add a new Watch (⌘+N or click the + in the Watches pane) and start typing.

Let's say for some reason I wanted to see what Intent extras, if any, had been passed into the current Activity. I just add a new Watch and put in the usual way of getting an Activity's extras -- getIntent().getExtras() and now I can inspect what I have been given when this Activity was launched. Easy peasy.


Now in the IntelliJ documentation, there is a quote that says:
Watch expressions are always evaluated in the context of a stack frame that is currently inspected in the Frames pane.
Similar to the way "context" is defined in the real world (and in the Android world too, I guess) this means that Watches will only make sense if they are in used in the correct circumstance where it can be fully understood. Still confused?

Say I am now stopped at a breakpoint in a Fragment (The Frames pane says I am in the method getRandomSublist() in CheeseListFragment.java) and I would like to see the extras passed into this Fragment's host Activity. The previously added Watch will not work since in our current context -- that of a Fragment -- there is no such method getIntent(). To do what I want, I would need to call the Activity first -- getActivity().getIntent().getExtras() (= null, there are no extras received!).


Pretty coooooool. I think in a sense, you can think of Watches as coding without actually coding. Happy debugging!


25 February 2016

Taking a closer look while debugging

One of the most common sources of bugs (at least of my bugs) is math. I have been working on dynamically resizing a View the past days, and it was driving me nuts! I needed to consider preserving aspect ratio, device density, original view size, etc etc. Math is hard guys!

Thankfully, Android Studio has a bunch of tools that can help us make debugging stuff like this a little less painful.

The debug tool window is your friend


The debug tool widnow shows you a TON of helpful information when stopped at a particular breakpoint. On the left, you can see all the calls that were done until you arrive at a particular breakpoint. Clicking on one of those will open the corresponding file and show you the exact line. A gif paints a thousand words so here you go:


The second pane shows you all variables in the currently selected file. This means that if you step through the method calls as described above, the displayed variables will change depending on that file. If you want to further inspect properties of a variable, you can expand that and do a deeper dive (this for instance, will show all inherited fields as well).

More inspection options

One thing I love about Android Studio is that it shows you inline some pretty useful information about a variable.

Here I can see that view is a LinearLayout, among other things. If you want to further inspect the properties of this view, you can either (1) go through the variable pane as described above, or (2) look at the params directly from that line of code.

I find Option 2 more appealing since I have more context on what I was trying to do with this variable, and if I did anything to it before or after a specific line of code. Here's option 2 in action:
Hover over the variable of interest then click on the + all the way to the left (Or +F1) then inspect to your heart's content.

Doing things with what we inspected

Now that we know what properties the variable we are interested in has, it's time to actually look at what we are doing with those properties. Say you are trying to arrive at a value that will depend on the height of this view. You do some basic math:
view.getHeight() / 2

You can ask Android Studio to tell you what that resolves into by asking it to evaluate the expression. Highlight interesting expression, right click, choose Evaluate Expression (alternative: highlight expression then +F8). Studio will then show you a pop up with the selected expression; you can edit the expression here as you wish. Once ready, click Evaluate and you can now see what the result would have been if this expression was actually ran.


Most of the time, however, we are not interested in computing values on the fly. We know what variable we are interested in, we know if there's any property of that variable we wanted to look at, and we know that we are doing some (possibly weird) math. This is when Watches become extremely useful. If you paid close attention to the Evaluate Expression gif, you would have noticed that there's a tiny footnote below the expression text: Use Control+Shift+Enter to add to Watches.

Watches

Watches is that unassuming pane all the way to the right of the debug tool window in the very first screenshot. Here you can add any number of variables and expressions and the Watches pane will resolve them all for you in the context of the current frame (Patience grasshopper, you will soon know what this means).

One way to add watches is to evaluate an expression and use the shortcut as hinted above. Another way is to highlight the expression then choose Add to Watches from the context menu. Once added you can see the expression and the evaluated value immediately in the Watches pane.

You can also manually add a Watched value by clicking on the + in the Watches pane itself. The cool thing about doing it manually? Autocomplete!!

The amazing thing and most useful thing about Watches is that the values are updated as you step through the code AND are retained across debugging sessions.
Once I step through the code (F8), the expressions in Watches are updated within the current frame's context. Notice how initially changeBounds is undefined? Step over until we hit the assignment and the value we are watching is updated.

TL;DR?

My favourite reasons for loving Watches:

  • I do not have to Timber or Toast or Log all the expressions I am interested in
  • Evaluated expressions, but lots of them
  • No need to re-add when looking at particularly nasty bugs
  • Quick and easy way to view results by changing expressions on the fly

There are a LOT more ways of maximising your mileage with Watches, so head on over to the IntelliJ blog to read all about them!

PS: Clicking on the images/gifs to embiggen should work (I hope)!

05 February 2016

Squashing Bugs

This has been one hell of a busy week for me. I think you can sort of tell from my Tweets and G+ posts that I have been debugging A LOT.

I was helping the new guy on our team look at something, and I think I almost gave him a heart attack.
It takes FOREVER to launch the app when you click that green bug. I hate that green bug. Save yourself some heartache:
  1. Put in your breakpoints
  2. Launch the app as you normally would
  3. Navigate to the offending activity
  4. Attach Debugger to Android Process

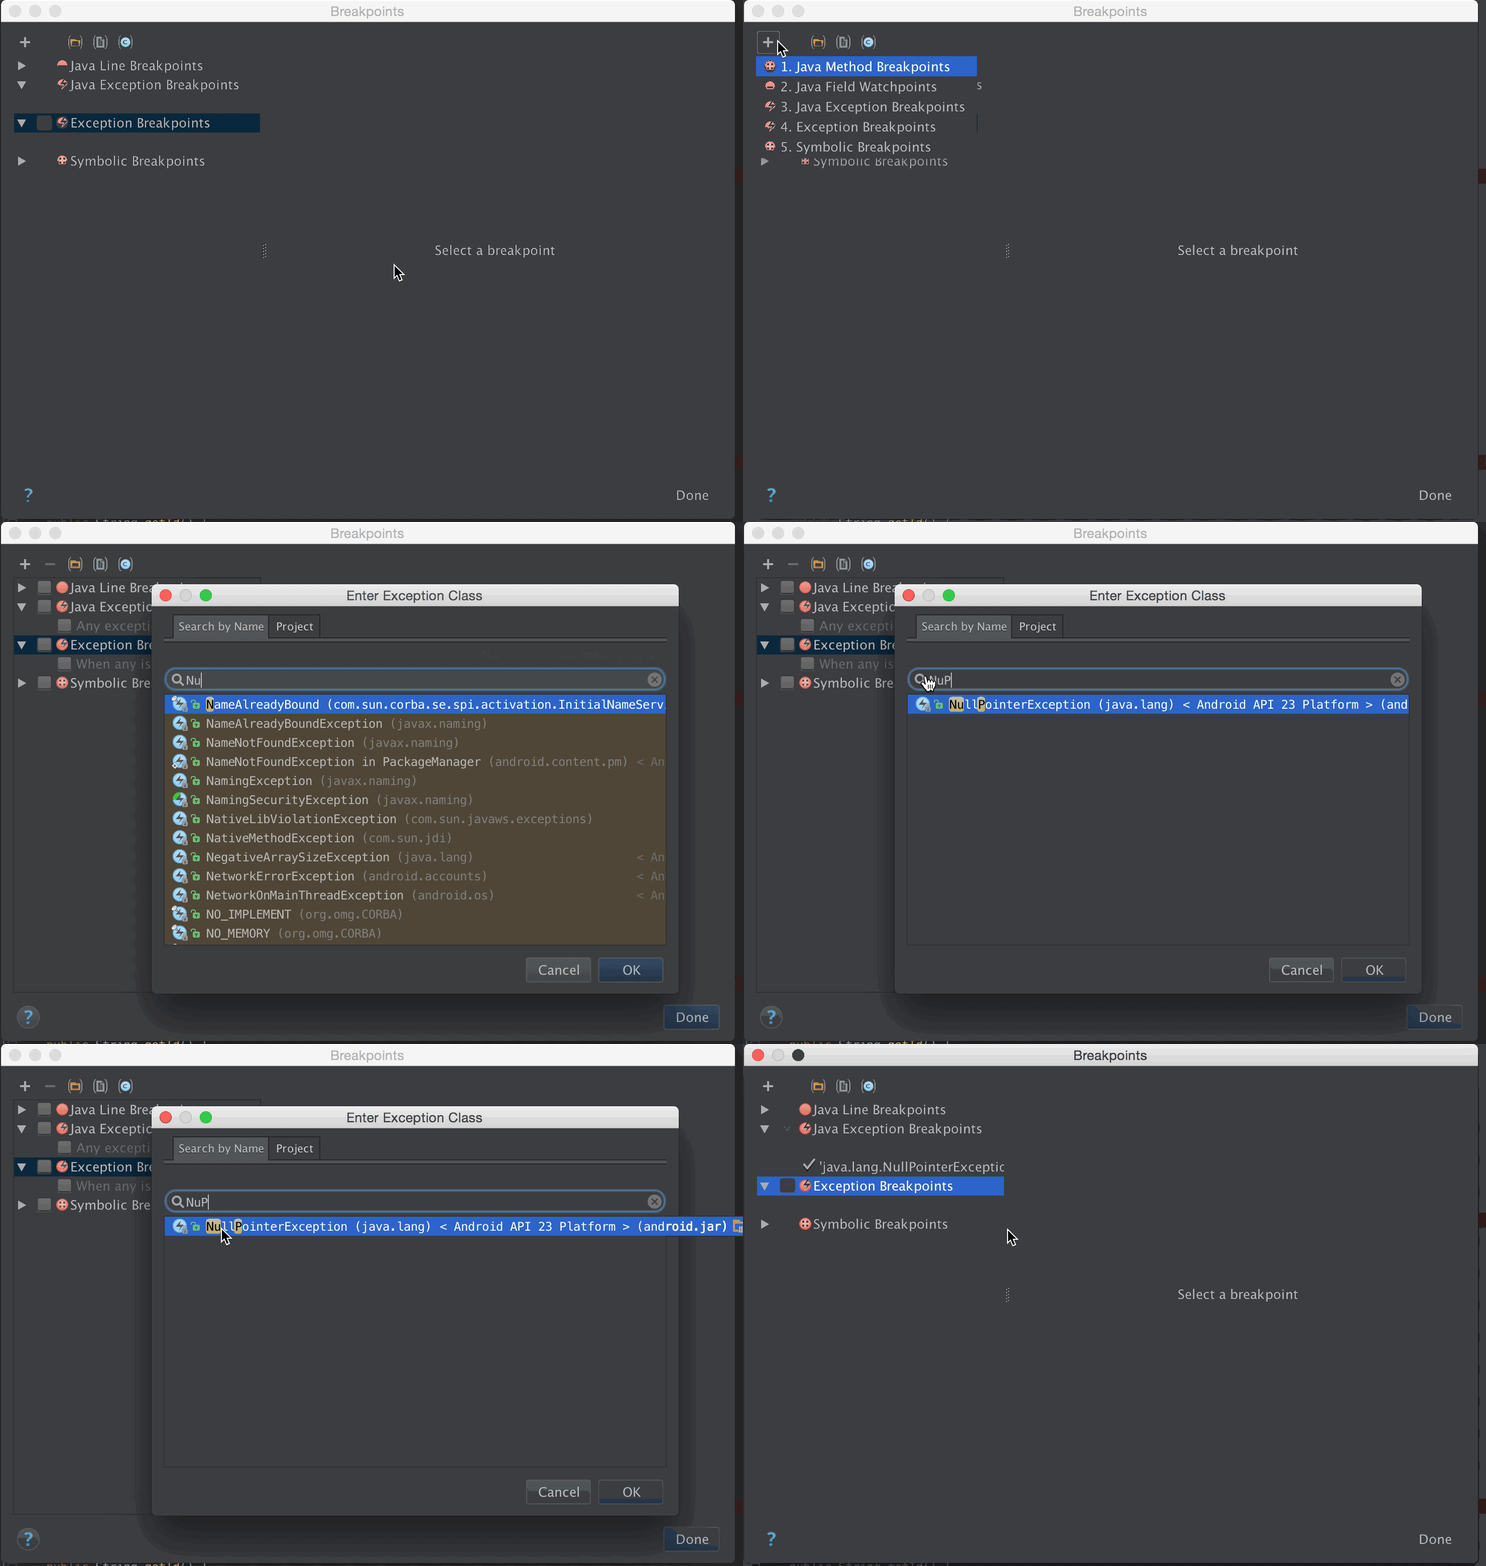
App encountering what looks like random crashing? Put in some exceptionally useful Exception Breakpoints! In the Breakpoints dialog (⌘+⇧+F8 / CMD+SHIFT+F8), click on the +, choose Java Exception Breakpoints and add the exception you are interested in.

This means that even without actual breakpoints -- as long as the debugger is attached to the process -- Android Studio will suspend the process on the exact line that will throw the exception. Very easy way of narrowing down on the root cause!

But what if (God forbid!) you uncover another issue while debugging? Now you have a ton of breakpoints but you don't want to remove them because what if you still haven't fixed that other thing and this line is really important but you don't want to stop all the time. Ugh. It's a mess!

Make some semblance of order out of the chaos. Group your breakpoints. A breakpoint group can contain any number of any kind of breakpoint that Android Studio supports. This allows you to mute/unmute a set of breakpoints without having to hunt them down one by one.

Just choose the interesting breakpoints, right click, then choose Move to group. From here you can either create a new group or add them to an existing group. You can configure each breakpoint to behave how you want them to: suspend the thread, log a message, hit and forget, etc.

Here's the whole thing, in one magnificent gif.


Again, apologies to +Nick Butcher. I owe you a beer next time you're in Sydney, Nick.

10 September 2015

Raising Activities From the Dead

One of the scenarios I admittedly almost always forget to test is "What happens when my app goes into the background, then the OS kills is to claim memory, then I try to resume?" Usually it's "Well, I handle onSavedInstanceState not being null, so I am great!" It is fine and dandy for simple apps; but once your Activity or Fragment gets beefier and you start relying on state for more and more things, it can get complicated pretty quickly (In my case, the Fragment has setRetainInstance(true)).

This scenario in particular is kind of hard to reproduce willingly. I usually see this when I leave an app running, make my phone do some heavy work overnight, then resume the app the next day.

So what you gonna do?

It turns out that Android Studio has the answer! There is this magical tiny red button that allows you to simulate this exact scenario.

1. Open your app to the Activity you want to test (I use a very simple app here just for demo).


2. In Studio, go to Android Monitor (make sure that your app is selected). Note the process ID, in this case it is 25647.

3. Push your app to the background. Pressing the HOME button should be sufficient. This will call onSaveInstanceState, which is all that matters really. It is after all what we want to test.

4. Back in Studio, press the magical tiny red button pointed to in the previous image. Notice that Studio now appends [DEAD] to your app's process. It is now gone. He's dead, Jim!

5. Resume your app. I usually just do this via recent apps.

6. If you look at Studio, you'll see that your app is now no longer dead, but has a new process ID, in this case 26742.

If at this point you step through your code, you will notice that your Activity will go through the whole (re-)creation process with the Bundle given the values you have saved in onSaveInstanceState. No more waiting overnight, yay!

03 November 2012

Quick Tip: Pulling an SQLite db file from device

I have always thought that you would need root access to pull an SQLite file from a non-rooted Android device. Turns out I thought wrong! Here's how you do it:
$ adb -d shell
$ run-as your.package.name
$ cat /data/data/your.package.name/databases/yourdatabasename  >/sdcard/yourdatabasename
This will copy your app's SQLite db file to the SD card's root directory. From there, you can copy the file to your computer any way you like.

Props to this SO answer!

17 May 2012

Inspecting your Shared Preferences

Did you know that you can look at your SharedPreferences file?

If during development you want to inspect what your SharedPreferences now contain, you can pull a copy of the XML file from the emulator.

In Eclipse, you can do that by following these steps:

  1. Open the DDMS perspective (Window > Open Perspective > Other > DDMS).
  2. Click on the File Explorer tab and navigate to your app's data folder (that's under data/data/<your package name>/shared_prefs/).
  3. Choose the file you want to download.
  4. Click on the Pull file from device button.