25 February 2016

Taking a closer look while debugging

One of the most common sources of bugs (at least of my bugs) is math. I have been working on dynamically resizing a View the past days, and it was driving me nuts! I needed to consider preserving aspect ratio, device density, original view size, etc etc. Math is hard guys!

Thankfully, Android Studio has a bunch of tools that can help us make debugging stuff like this a little less painful.

The debug tool window is your friend


The debug tool widnow shows you a TON of helpful information when stopped at a particular breakpoint. On the left, you can see all the calls that were done until you arrive at a particular breakpoint. Clicking on one of those will open the corresponding file and show you the exact line. A gif paints a thousand words so here you go:


The second pane shows you all variables in the currently selected file. This means that if you step through the method calls as described above, the displayed variables will change depending on that file. If you want to further inspect properties of a variable, you can expand that and do a deeper dive (this for instance, will show all inherited fields as well).

More inspection options

One thing I love about Android Studio is that it shows you inline some pretty useful information about a variable.

Here I can see that view is a LinearLayout, among other things. If you want to further inspect the properties of this view, you can either (1) go through the variable pane as described above, or (2) look at the params directly from that line of code.

I find Option 2 more appealing since I have more context on what I was trying to do with this variable, and if I did anything to it before or after a specific line of code. Here's option 2 in action:
Hover over the variable of interest then click on the + all the way to the left (Or +F1) then inspect to your heart's content.

Doing things with what we inspected

Now that we know what properties the variable we are interested in has, it's time to actually look at what we are doing with those properties. Say you are trying to arrive at a value that will depend on the height of this view. You do some basic math:
view.getHeight() / 2

You can ask Android Studio to tell you what that resolves into by asking it to evaluate the expression. Highlight interesting expression, right click, choose Evaluate Expression (alternative: highlight expression then +F8). Studio will then show you a pop up with the selected expression; you can edit the expression here as you wish. Once ready, click Evaluate and you can now see what the result would have been if this expression was actually ran.


Most of the time, however, we are not interested in computing values on the fly. We know what variable we are interested in, we know if there's any property of that variable we wanted to look at, and we know that we are doing some (possibly weird) math. This is when Watches become extremely useful. If you paid close attention to the Evaluate Expression gif, you would have noticed that there's a tiny footnote below the expression text: Use Control+Shift+Enter to add to Watches.

Watches

Watches is that unassuming pane all the way to the right of the debug tool window in the very first screenshot. Here you can add any number of variables and expressions and the Watches pane will resolve them all for you in the context of the current frame (Patience grasshopper, you will soon know what this means).

One way to add watches is to evaluate an expression and use the shortcut as hinted above. Another way is to highlight the expression then choose Add to Watches from the context menu. Once added you can see the expression and the evaluated value immediately in the Watches pane.

You can also manually add a Watched value by clicking on the + in the Watches pane itself. The cool thing about doing it manually? Autocomplete!!

The amazing thing and most useful thing about Watches is that the values are updated as you step through the code AND are retained across debugging sessions.
Once I step through the code (F8), the expressions in Watches are updated within the current frame's context. Notice how initially changeBounds is undefined? Step over until we hit the assignment and the value we are watching is updated.

TL;DR?

My favourite reasons for loving Watches:

  • I do not have to Timber or Toast or Log all the expressions I am interested in
  • Evaluated expressions, but lots of them
  • No need to re-add when looking at particularly nasty bugs
  • Quick and easy way to view results by changing expressions on the fly

There are a LOT more ways of maximising your mileage with Watches, so head on over to the IntelliJ blog to read all about them!

PS: Clicking on the images/gifs to embiggen should work (I hope)!

22 February 2016

LinearLayouts, TextViews and Drawables

I sent out a series of tweets today about LinearLayouts and unexpectedly, quite a few people like them. I decided to get off my lazy ass and actually write it down in a post for easy reference.

Let's start with the LinearLayout root view.  One of the most common things designers ask us to do is to put dividers in. Quick! Think! What should we do? Add a generic View for each divider? How about NO? Instead, we can delegate the task of displaying these dividers to the LinearLayout itself:
<?xml version="1.0" encoding="utf-8"?>
<LinearLayout xmlns:android="http://schemas.android.com/apk/res/android"
              android:layout_width="match_parent"
              android:orientation="vertical"
              android:layout_height="match_parent"
              android:divider="@drawable/divider_horizontal_dark"
              android:showDividers="middle">

Where divider_horizontal_dark can be anything you want to be the divider (I recommend using a shape):

<?xml version="1.0" encoding="utf-8"?>
<shape xmlns:android="http://schemas.android.com/apk/res/android"
       android:shape="rectangle" >
    <solid android:color="#24000000" />
    <size android:height="1dp" />
</shape>

Doing this prevents us from littering our view hierarchy with useless empty views. LinearLayout is actually extremely powerful, and a lot of the stuff most apps usually need is already built in. PS: For some reason I cannot find the showDividers attribute in the Android docs, but the available attributes are middle, beginning, endnone (or a combination of those). EDIT+Nick Butcher showed us the light: docs here!

EDIT AGAIN: Nick has also lovingly pointed out that setShowDividers() was added in API 11. If by some cruel twist of fate you need to support anything below that, use LinearLayoutCompat. Also, you poor, poor thing.

Another common thing that we are asked to do is to have an image +  text displayed side by side. We use this quite a bit in the Domain app, most notably in the main navigation drawer:

Instead of having one huge RelativeLayout or (horror!) nested LinearLayouts, we can just have a bunch of TextViews in one LinearLayout.

You see, TextViews have this magical ability to add Drawables to themselves. You can position the Drawable anywhere you want, and even tint it from XML! :gasp:

Drawable placement can be in any of the cardinal directions (bottom, top, left, right) and the tint should be a defined colour in XML (not actually required, but encouraged. By me. I encourage it.). If the Drawable is too close to the text for your or your designer's taste, you can adjust the distance via the drawablePadding attribute.

So here's a screen of four TextViews in one LinearLayout:


And the full code (also in github):
<LinearLayout xmlns:android="http://schemas.android.com/apk/res/android"
              android:layout_width="match_parent"
              android:orientation="vertical"
              android:layout_height="match_parent"
              android:divider="@drawable/divider_horizontal_dark"
              android:showDividers="middle">

    <TextView
        android:id="@+id/text1"
        android:drawableTop="@drawable/ic_notifications_black_24dp"
        android:drawableTint="@color/lemongrab"
        android:drawablePadding="8dp"
        android:layout_width="match_parent"
        android:layout_height="wrap_content"
        android:textSize="20sp"
        android:padding="16dp"
        android:text="Text 1"/>

    <TextView
        android:id="@+id/text2"
        android:textSize="20sp"
        android:drawableRight="@drawable/ic_notifications_black_24dp"
        android:drawablePadding="8dp"
        android:padding="16dp"
        android:layout_width="match_parent"
        android:layout_height="wrap_content"
        android:text="Text 2"/>

    <TextView
        android:id="@+id/text3"
        android:layout_width="match_parent"
        android:layout_height="wrap_content"
        android:drawableLeft="@drawable/ic_notifications_black_24dp"
        android:drawablePadding="8dp"
        android:padding="16dp"
        android:text="Text 3"
        android:textSize="20sp"/>


    <TextView
        android:id="@+id/text4"
        android:layout_width="match_parent"
        android:layout_height="wrap_content"
        android:drawableLeft="@drawable/ic_notifications_black_24dp"
        android:drawablePadding="8dp"
        android:padding="16dp"
        android:text="Text 4"
        android:textSize="20sp" />


</LinearLayout>

If you need to update the Drawable tint at runtime (if you are basing it on some status field, for example), you can do so via code:

// left, top, right, and bottom
DrawableCompat.setTint(mText3.getCompoundDrawables()[0].mutate(), ContextCompat.getColor(this, R.color.red));

Note that we need to call mutate() or else the tint will be everywhere and it's gonna be a mess!

So there you have it! Remember kids, #perfmatters!

05 February 2016

Squashing Bugs

This has been one hell of a busy week for me. I think you can sort of tell from my Tweets and G+ posts that I have been debugging A LOT.

I was helping the new guy on our team look at something, and I think I almost gave him a heart attack.
It takes FOREVER to launch the app when you click that green bug. I hate that green bug. Save yourself some heartache:
  1. Put in your breakpoints
  2. Launch the app as you normally would
  3. Navigate to the offending activity
  4. Attach Debugger to Android Process

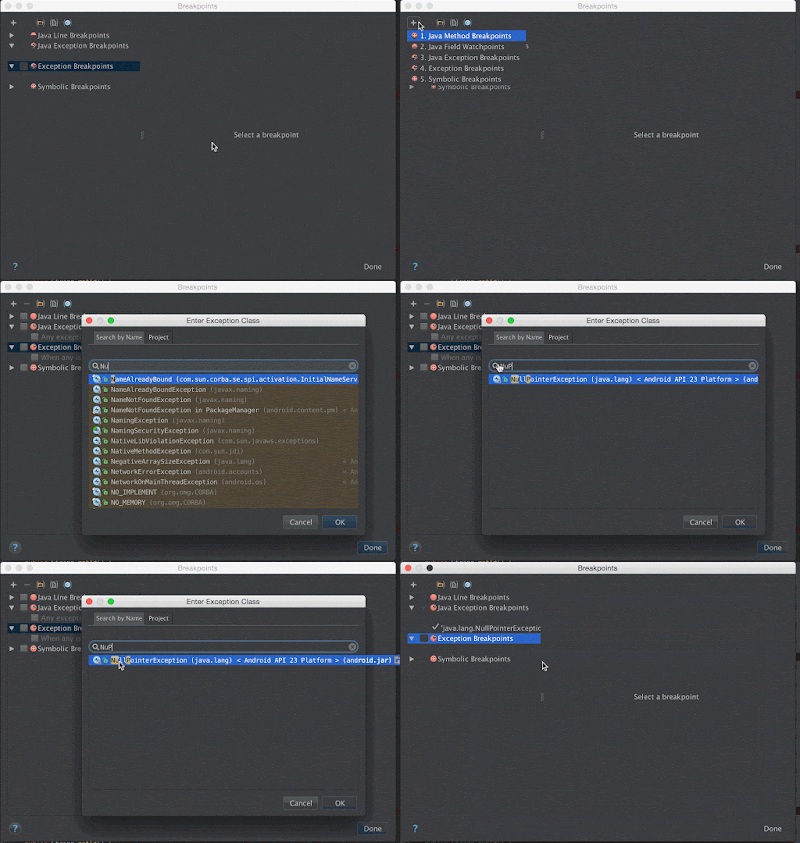
App encountering what looks like random crashing? Put in some exceptionally useful Exception Breakpoints! In the Breakpoints dialog (⌘+⇧+F8 / CMD+SHIFT+F8), click on the +, choose Java Exception Breakpoints and add the exception you are interested in.

This means that even without actual breakpoints -- as long as the debugger is attached to the process -- Android Studio will suspend the process on the exact line that will throw the exception. Very easy way of narrowing down on the root cause!

But what if (God forbid!) you uncover another issue while debugging? Now you have a ton of breakpoints but you don't want to remove them because what if you still haven't fixed that other thing and this line is really important but you don't want to stop all the time. Ugh. It's a mess!

Make some semblance of order out of the chaos. Group your breakpoints. A breakpoint group can contain any number of any kind of breakpoint that Android Studio supports. This allows you to mute/unmute a set of breakpoints without having to hunt them down one by one.

Just choose the interesting breakpoints, right click, then choose Move to group. From here you can either create a new group or add them to an existing group. You can configure each breakpoint to behave how you want them to: suspend the thread, log a message, hit and forget, etc.

Here's the whole thing, in one magnificent gif.


Again, apologies to +Nick Butcher. I owe you a beer next time you're in Sydney, Nick.